
Chapters:
1: Introduction
2: Simple example
3: Invocation
4: Finer Control
5: X-Y Plots
6: Contour Plots
7: Image Plots
8: Examples
9: Gri Commands
10: Programming
11: Environment
12: Emacs Mode
13: History
14: Installation
15: Gri Bugs
16: Test Suite
17: Gri in Press
18: Acknowledgments
19: License
Indices:
Concepts
Commands
Variables
2: Simple Gri Program and How to Run it
This chapter introduces Gri with a common example: an x-y graph. The example is discussed in detail later (see X-y Plots). The data files and command files here and throughout the manual should be available to you in a directory `.../gri/examples' on unix machines.
2.1: Gri Command file
Here is a Gri command file to plot a linegraph of a set of (x,y) data, stored as space-separated columns in a file called `example1.dat':
# Example 1 -- Linegraph of data in separate file open example1.dat # Open the data file read columns x y # Read (x,y) columns draw curve # Draw data curve draw title "Example 1"# Title above plot |
The first line is a comment, as are all things following hash symbols (`#').
(An exception to this rule is made within strings contained
within the double-quote character `"'. This allows `sed'
system commands to work as expected; (see System).)
The other lines are Gri command lines; (see X-y Plots) for more explanation.
2.2: Data File
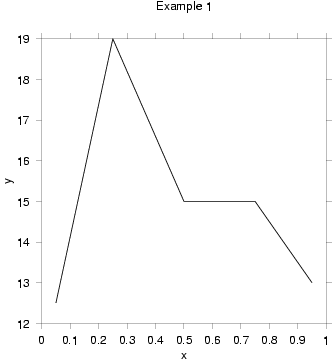
The data file `example1.dat' looks like:
0.05 12.5 # first point 0.25 19 # second point 0.5 15 # third point 0.75 15 # ... you get the idea! 0.95 13 |
Note that spaces (or tabs) separate numbers. Any data line may have a comment on it, just as any command line may.
2.3: Running The Command File
Type `gri example1.gri' at the system prompt. Gri will create a PostScript file called `example1.ps'. For details on running Gri see see Invoking Gri.
2.4: Output Graph
The output PostScript file is called `example1.ps'.
 Click the plot to enlarge it.)
It looks something like the miniature shown above. To view Gri output, use your favorite PostScript previewer.
Note that in the above example, Gri automatically chose reasonable scales for the axes, based on the range of the data. The next chapter illustrates that Gri also gives you control over such things.
