Chapters:
1: Introduction
2: Simple example
3: Invocation
4: Finer Control
5: X-Y Plots
6: Contour Plots
7: Image Plots
8: Examples
9: Gri Commands
10: Programming
11: Environment
12: Emacs Mode
13: History
14: Installation
15: Gri Bugs
16: Test Suite
17: Gri in Press
18: Acknowledgments
19: License
Indices:
Concepts
Commands
Variables
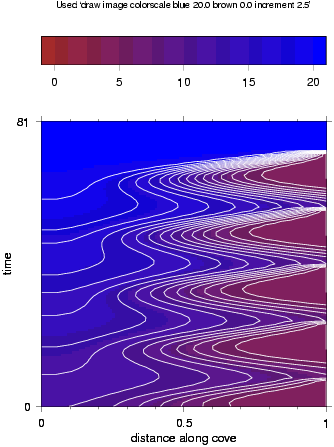
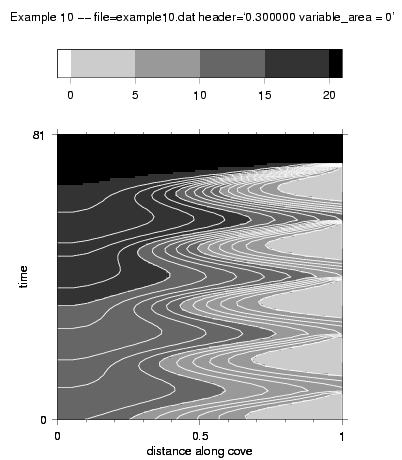
8.4: Combination of image and contour
The following example reads gridded data and creates an image as in the previous example, but also superimposes unlabelled white contour lines.
(In the plot shown, all `query' questions were answered with
carriage return, yielding the defaults; the `-p' flag was specified
on execution, so the time stamp was not drawn.)
A color version of this is possible using `set image colorscale'
as shown here: