Chapters:
1: Introduction
2: Simple example
3: Invocation
4: Finer Control
5: X-Y Plots
6: Contour Plots
7: Image Plots
8: Examples
9: Gri Commands
10: Programming
11: Environment
12: Emacs Mode
13: History
14: Installation
15: Gri Bugs
16: Test Suite
17: Gri in Press
18: Acknowledgments
19: License
Indices:
Concepts
Commands
Variables
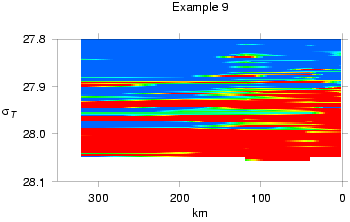
8.3: Image created from coarsely gridded data
This example reads gridded ascii station data (`Read Data'),
creates an interpolated image (`convert grid ...'), and then plots
the image.
There are some other useful tricks in this example, such as calling
`awk' and `wc' from the unix system.
(In the plot shown, all `query' questions were answered with
carriage return, yielding the defaults; the `-p' flag was specified
on execution, so the time stamp was not drawn.)