Chapters:
1: Introduction
2: Simple example
3: Invocation
4: Finer Control
5: X-Y Plots
6: Contour Plots
7: Image Plots
8: Examples
9: Gri Commands
10: Programming
11: Environment
12: Emacs Mode
13: History
14: Installation
15: Gri Bugs
16: Test Suite
17: Gri in Press
18: Acknowledgments
19: License
Indices:
Concepts
Commands
Variables
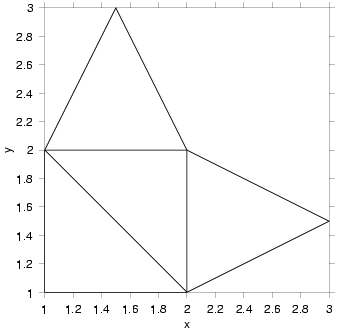
8.11: Finite Element Model mesh
Finite Element Models (used in fluid mechanics) employ non-rectangular meshes, and plotting these meshes requires a few intermediate steps. Consider the common case of triangular elements. Suppose two data files exist describing the mesh, the first, `model.nodes' say, consists of a description of the x-y coordinates of the nodes (vertices) of the triangles. The second, `model.elements' say, consists of a description of which triplet of nodes defines each triangle in the mesh. Here, from a sample application, is a node file called `model.nodes':
1 1 1 2 2 1 3 1 2 4 3 1.5 5 2 2 6 1.5 3 |
Here is the corresponding file of the elements, called `model.elements'
1 1 2 3 2 2 5 3 3 2 4 5 4 3 5 6 |
In each of these files, the first column is a reference number. Thus,
`model.elements' indicates that the first triangle is defined by
the nodes numbered `1', `2' and `3' as defined in
`model.nodes'. More specifically, the triangle is defined by
vertices at (x,y) locations (1,1), (2,1), and (1,2).
A Gri program, named `FEM.gri', to draw the nodes is the following.
set missing value -99.99 # Create data using perl-script ... system FEM.pl model.nodes model.elements > tmp # ... then plot it ... open tmp read columns x y close draw curve # ... and, finally, clean up the temporary file system rm tmp |
The work of interpreting the data files is done by the perlscript that follows, named `FEM.pl'
#!/usr/bin/perl -w
$missing = -99.99; # missing value
$node_file = $ARGV[0];
$element_file = $ARGV[1];
open (NODE, $node_file)
or die "Cannot open '$node_file' file";
open (ELEM, $element_file)
or die "Cannot open '$element_file' file";
|
The resultant image is below.